How to Effectively Use Columns and Segments in Google Ads

Columns and segments in Google Ads are two powerful tools that can help you make sense of your campaigns’ data. Columns allow you to choose the specific metrics you want to track, while segments allow you to group your data by different criteria.
By using columns and segments together, you can create custom reports that give you a deep understanding of how your campaigns are performing. This information can help you make better decisions about your bidding strategy, ad copy, and targeting.
Columns in Google Ads
Columns in Google Ads are the data metrics or statistics that provide insights into the performance of your Google Ads campaigns. They are organized in a tabular format within the Google Ads interface, allowing you to see key information at a glance
Columns can be used to track and compare the performance of your campaigns, ad groups, keywords, and other elements of your Google Ads account.
There are many columns you can use, from columns that show performance-related metrics, to columns that focus on conversions, quality assessments, or other campaign metrics and attributes.
You can choose which columns to display by selecting the desired columns from the drop-down menus.
There are two main types of columns in Google Ads:
- Standard columns: These columns are available by default and track common metrics such as:
- Impressions: The number of times your ad was shown.
- Clicks: The number of times people clicked on your ad.
- Conversions: The number of people who took a desired action after clicking on your ad, such as making a purchase or signing up for your email list.
- Cost: The amount of money you spend on your ad.
- Custom columns: These columns can be created by combining data from different standard columns and segment metrics. This allows you to track more specific metrics that are relevant to your business. Here are some useful custom column examples:
- Net profit: (conversion value x profit margin) – costs
- Profitable revenue per click: conversion value x profit margin/clicks
- Efficiency ratio: costs/conversion value
- Return on ad spend (ROAS): conversion value/costs
Benefits of Columns in Google Ads
Columns provide a clear snapshot of how your campaigns are performing. You can quickly assess important metrics such as clicks, impressions, conversions, and costs to gauge overall performance.
This way you can identify areas that need improvement. For instance, you can spot keywords with high costs and low conversions, prompting you to adjust bids or refine ad copy. Moreover, columns also let you measure the impact of changes. If you alter ad elements or bidding strategies in Google Ads, columns allow you to determine which changes lead to better outcomes.
There are three Google Ads categories worth mentioning when talking about the benefits of columns: Google Analytics, quality score, and competitive metrics columns.
By default, Google Ads displays several Google Analytics metrics columns, such as the bounce rate and the percentage of new sessions. However, you can also create custom columns to track specific activities, called Google Analytics activity columns. For a step-by-step guide on how to add Google Analytics columns to your reports, check out this Google page.
Next, the competitive metrics columns. These metrics help you evaluate the performance of your campaigns and gather insights into your competitive position. An example of competitive metrics is impression share, which allows you to see the proportion of impressions your ads garner in relation to the total possible impressions they could attain.
Google Ads Quality Score columns display data such as your quality score and expected CTR. This way you can see how well your ad quality compares to other ads bidding for the same keywords.
Just remember to customize the columns displayed in your report so they reflect what matters most to your campaign goals.
Note: Some columns are only available for certain campaigns, for example, competitive metrics or quality score columns are only available to Search campaigns.
How to Create Custom Columns
Custom columns are one of the best reporting features in Google Ads. They give you the flexibility to structure and view data in a way that works best for you.
With a custom column, you can create and define your own unique metrics or formulas based on existing data columns. This feature enables you to perform more advanced analysis and gain insights that might not be available through standard columns alone.
Follow these steps to create custom columns on Google Ads:
- Log in to your Google Ads account and click on Campaigns
- Then, from the Campaigns dropdown menu, select Campaigns, Ad Groups, Ads, or Assets.
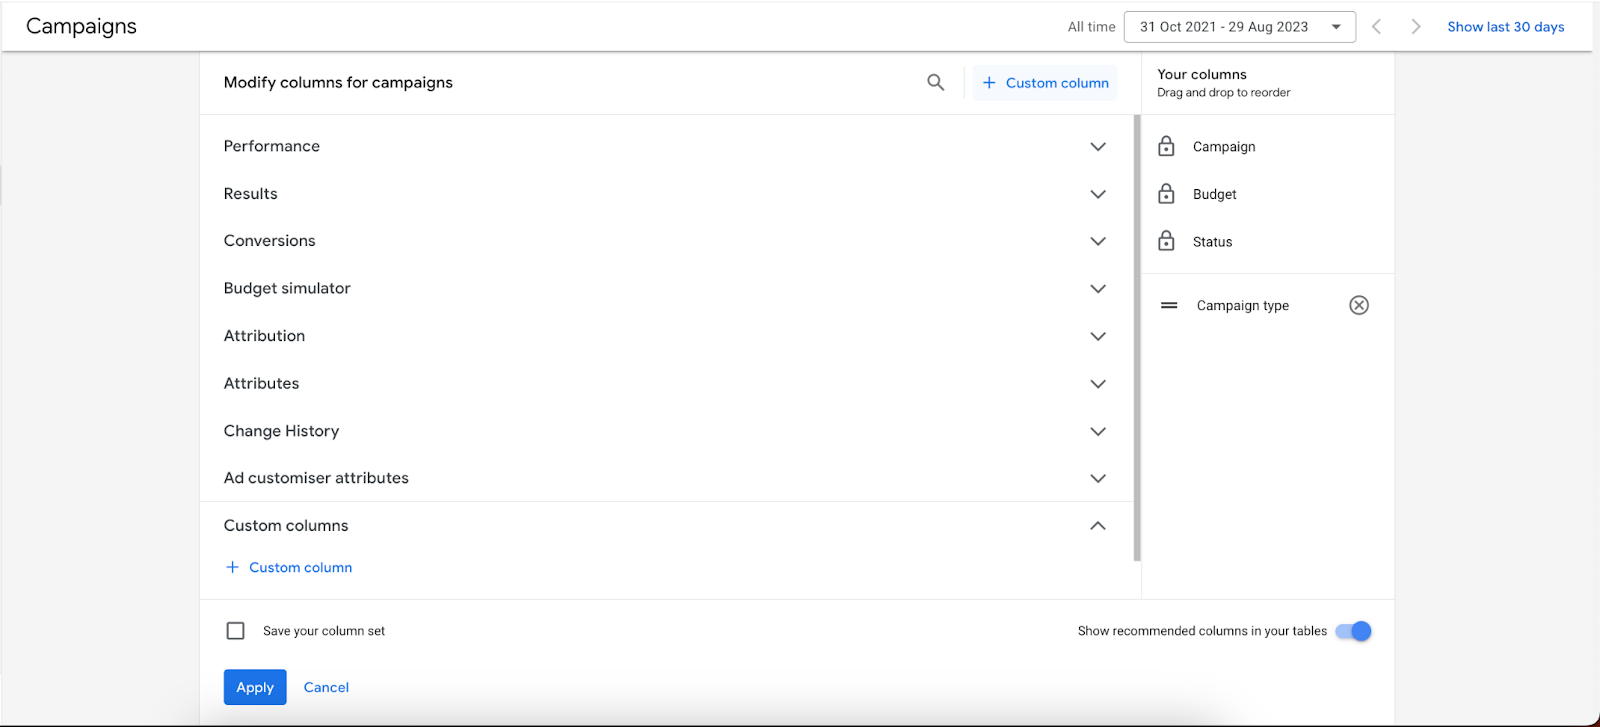
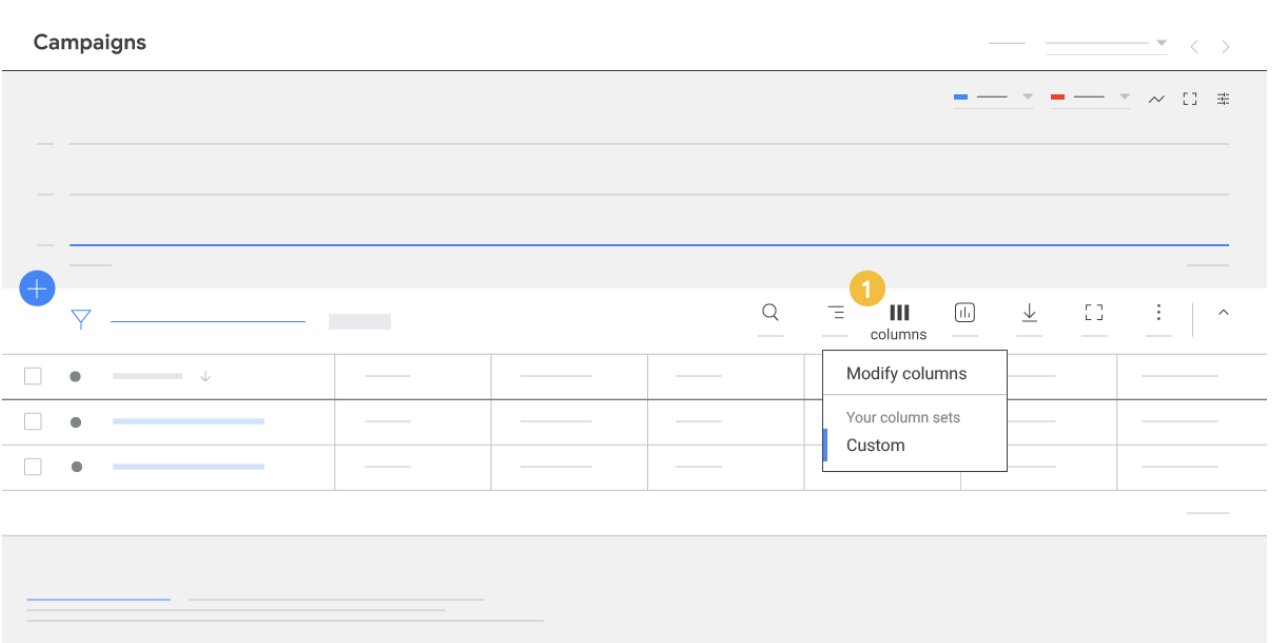
- Locate columns in the upper right corner of the table, and select Modify Columns
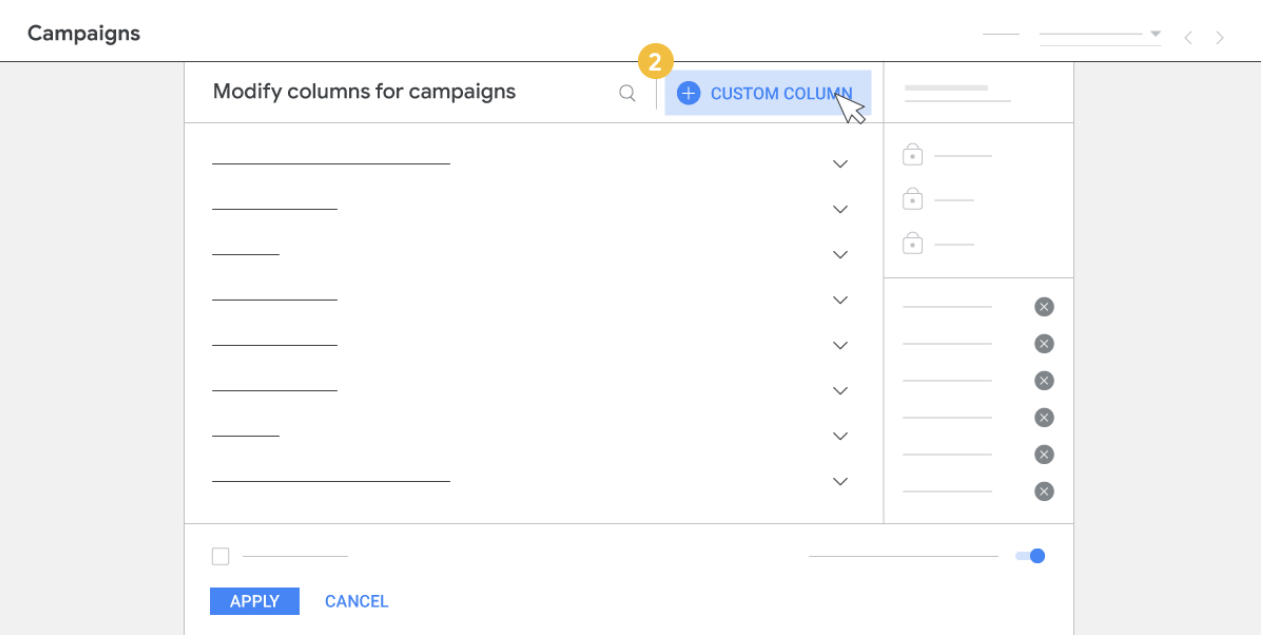
- Click +Custom column
- Fill in your column information, including your column name, description, filters, select metrics, and add math operators. In the screenshot below you can see some formula ideas.
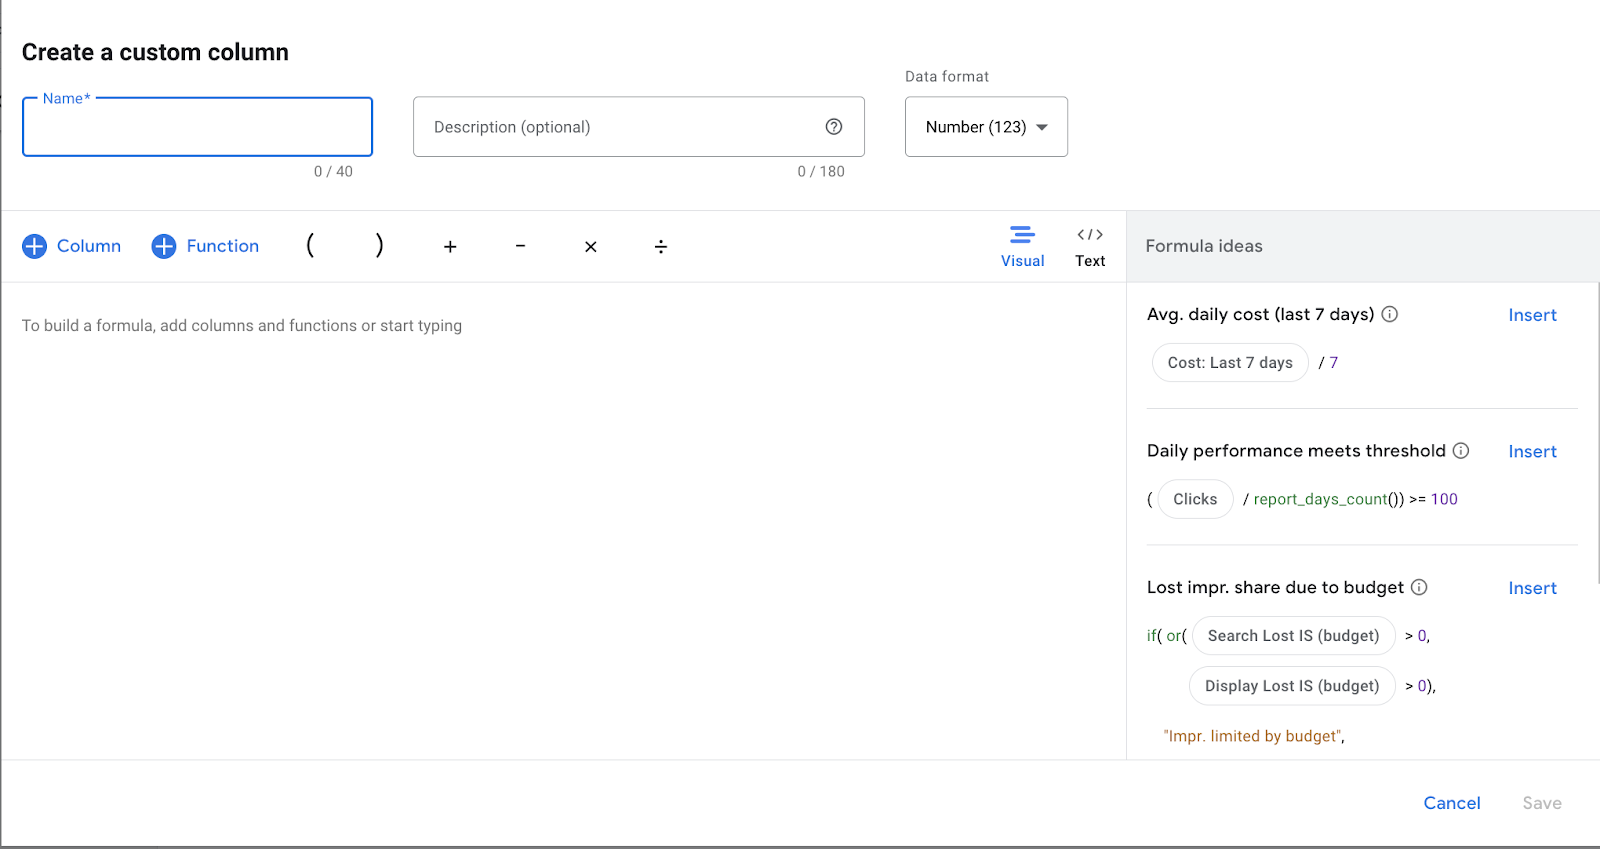
- Click Save when you’re done.
For more detailed information on building custom columns and how to build a custom column formula, check out Google’s help page on the topic.
Segments in Google Ads
In Google Ads, segments are a feature that allows you to break down your campaign data into more specific subsets for analysis. Segments enable you to view performance data from different angles, helping you gain deeper insights into how different factors influence the performance of your advertising campaigns.
Google Ads offers a variety of segmentation options, allowing you to focus on different dimensions of your campaign performance. Some common types of segments include:
- Time segments: Break down data based on specific time periods such as days, weeks, months, or hours. This helps you identify trends and patterns related to time of day, day of the week, or seasonality.
- Device segments: Divide data based on the device types users are using to interact with your ads, such as desktop, mobile, or tablet. This helps you optimize for different user experiences across devices.
- Network segments: Separate data based on where your ads are being shown, such as the Search Network or Display Network. This provides insights into the effectiveness of each network.
- Conversion segments: Focus on different conversion actions or categories. You can analyze which conversions are driving the most value for your business.
Benefits of Segments in Google Ads
There are many benefits of Google Ads, and segments allow you to examine data subsets, revealing trends and patterns that might not be apparent when viewing overall performance. With segmented data, you can make more precise optimizations.
For example, if you notice higher conversion rates on weekends, you can adjust your bidding strategy accordingly. If you analyze data segmented by device type, you can adjust bidding strategies to align with it. For instance, by placing a higher bid on the most profitable devices.
Segments can also help you understand how you are spending your budget. You can see where your budget is spent unnecessarily or needs adjustment. These are only some of the use cases of segments.
Ultimately, segments empower you to extract more meaningful insights from your campaign data, guiding you toward smarter decisions and more effective optimization strategies.
How to Segment Your Tables
You can easily add segments to your reporting tables by following these steps:
- Log in to your Google Ads account and click on Campaigns
- From the Campaigns dropdown menu, select Campaigns, Ad Groups, Ads, or Assets level.
- Locate segments in the upper right corner of the table, and select the data you want to isolate. Select None if you want to remove a segment.
Using Columns and Segments Together
Both columns and segments help you structure and make sense of your advertising data. By using columns and segments together, you can create customized views of your data that can help you make better decisions about your campaigns.
Let’s say you’re running ads on both the Search Network and Display Network. By combining network segments with columns displaying costs and conversions, you can evaluate which network delivers a better return on investment. This helps you allocate your budget more effectively to the higher-performing network.
Nevertheless, remember to focus on segments and columns that are most relevant to your business. Avoid overwhelming yourself with unnecessary data. It’s good to take your time and play around with looking at your data from different angles – but don’t get lost in the abyss. Remember your campaign objectives and the metrics that align with them. This clarity will guide your choice of columns and segments.
Note: Some columns may show a blank value when you apply an incompatible segment. So, let’s say you apply conversion-based segments like “Conversion action” and “Conversion lag”. These segments are only compatible with conversion-related columns like Conversions and Conversion value. Other columns like Cost, Clicks, and Impressions might show a blank value.
Our Final Thoughts
Understanding and leveraging columns and segments in Google Ads can significantly elevate your advertising game. These are powerful tools that can help you get more insights from your Google Ads data and improve your performance.
Here are some of the key points on using effectively columns and segments in Google Ads:
- Columns are the individual pieces of data that are displayed in your tables and charts. Some common columns include impressions, clicks, conversions, and cost.
- Segments are categories that you can use to group your data. For example, you could segment your data by device, location, conversion, or time.
- By using columns and segments together, you can create highly customized views of your performance data. This can help you to identify trends and patterns in your data, compare the performance of different campaigns, ad groups, or keywords, and identify areas where you can improve your performance.
- Tailor columns and segments to your campaign goals, focusing on metrics that matter most for your objectives.
Finally, remember that this isn’t about more data for the sake of data. It’s about extracting actionable insights to steer your campaigns toward success. So see these tools as strategic assets in order to make the most out of them.